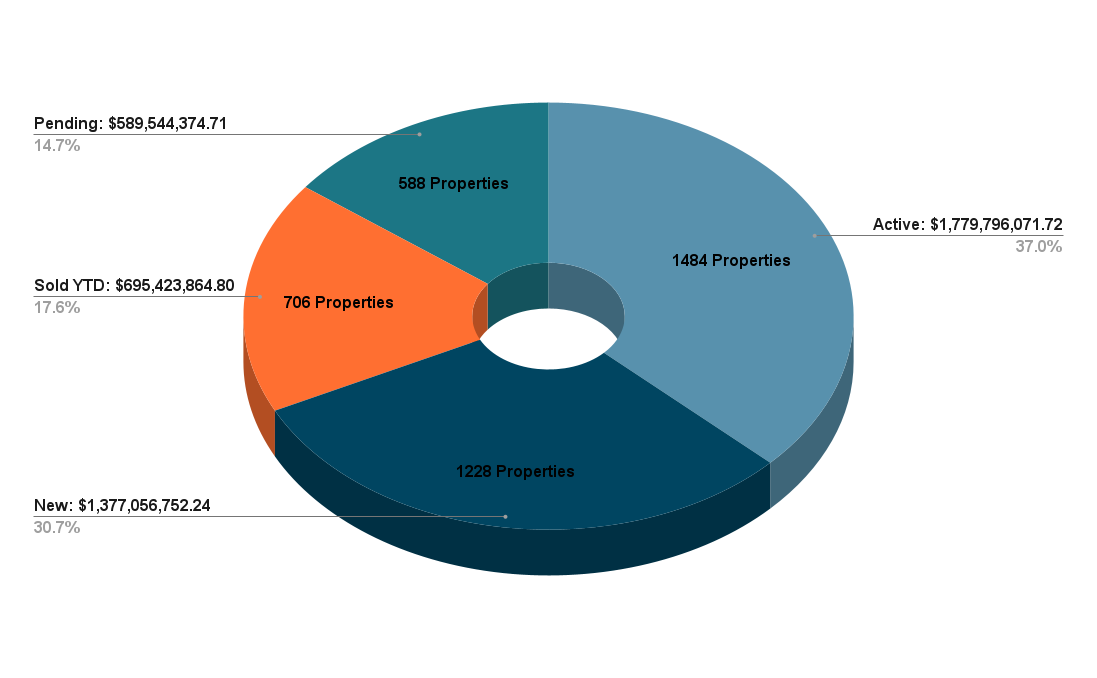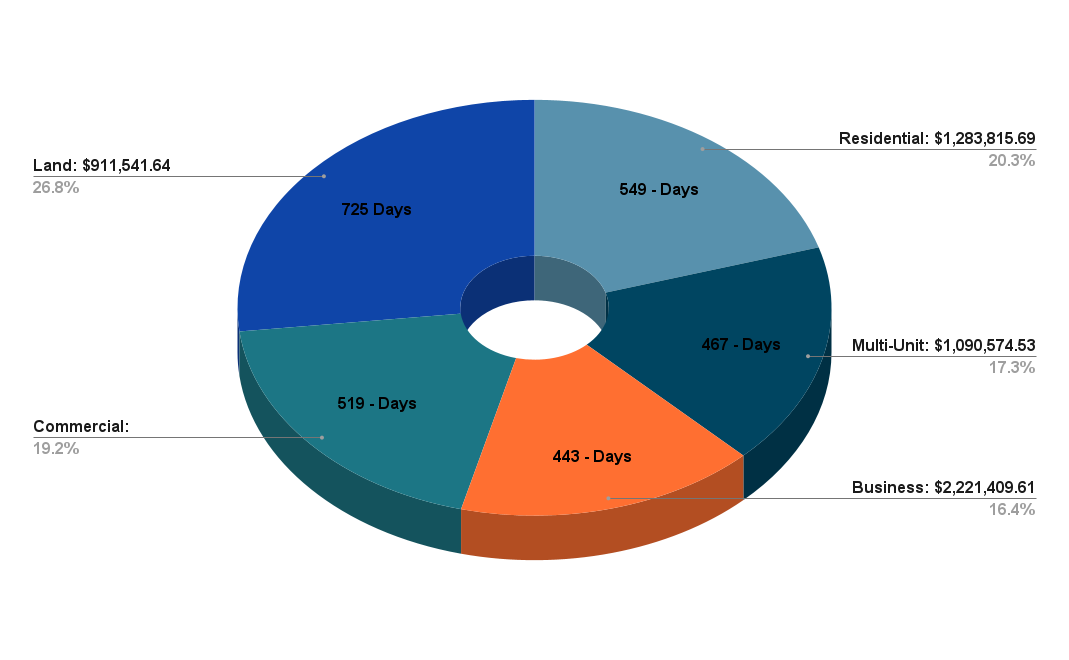


The Cayman Islands Real Estate Brokers Association (CIREBA) is thrilled to present the annual Property Market Update for 2020. This review embodies a year of unexpected challenges, resilience, and adaptability in the face of the global COVID-19 pandemic, offering a holistic view of the Cayman Islands real estate scenario during these unprecedented times. 1. COVID-19 Impact: The global pandemic undeniably impacted markets worldwide. The Cayman Islands was no exception. However, despite the challenges posed by the pandemic, the property market displayed resilience, maintaining a healthy balance of active, pending, and sold listings. Although there was a decline in YTD sales from 831 in 2019 to 706 in 2020, the higher average value of these sales indicates a continuing trend of investing in more premium properties. 2. Year-over-Year Analysis: 3. Duration Insights: Most categories witnessed a minor increase in the average time on the market, potentially due to COVID-19 related hesitations and travel restrictions, with business properties showing the most significant price hike. 2020, with its unique challenges, demonstrated the tenacity and resilience of the Cayman Islands' property market. Despite the pandemic's disruptions, the sector showed promising signs of stability and growth potential. CIREBA remains optimistic about the future and is committed to providing unmatched expertise in navigating the evolving landscape of real estate in the Cayman Islands.Key Figures:
Number of Properties 2020:
Active Listings Average Time on Market 2020:

Observations and Comparisons:
1) Sales: While properties sold YTD decreased by 15% from 2019's 831 to 2020's 706, the total value showed a positive shift from $636 million in 2019 to nearly $695 million in 2020.
2) Pending Sales: Interestingly, even though the number of properties pending reduced slightly from 623 in 2019 to 588 in 2020, the total value experienced an upsurge from $519 million in 2019 to almost $590 million in 2020.
3) New Listings: The market observed fewer new listings in 2020 with 1,128 compared to 1,388 in 2019, likely due to pandemic-driven uncertainties.


